SPY Financial Telemetry Report
Week Ending 2026-06-05
Published 2026-06-07
Market-State Telemetry from Options-Derived Expectations and Innovation Dispersion
The Vyreon Financial Telemetry Report summarizes current conditions using a multi-horizon expectation framework, innovation-based volatility diagnostics, and calibration monitoring. The objective is not to predict exact future prices, but to quantify how expectations, uncertainty, and structural conditions are evolving through time.
Executive Summary
Volatility is compressing, and price movement has become calmer relative to the recent volatility trend. Near-term conditions remain defensive but are improving, while long-term expectations remain constructive and continue to strengthen. Short- and medium-term horizons remain unresolved, so confirmation across timeframes is incomplete. The dominant feature of the current environment is declining volatility, with directional agreement still limited across the forecast windows.
Regime: Volatility Compression
Near-Term (~2 to 4 weeks): Recovering Defensive
Short-Term (~1 to 2 months): Defensive and Stable
Medium-Term (~2 to 4 months): Neutral and Unresolved
Long-Term (~6 to 12 months): Strengthening Constructive
Structure: Incomplete Confirmation
Market State
- Volatility is compressing, which is associated with calmer price movement, but lower variability does not establish broad directional agreement.
- Near-term structure remains negative but is recovering, which reflects improving short-horizon behavior, but the central tendency remains defensive.
- Medium-term structure remains neutral and unresolved, which reflects limited directional expression, but wide uncertainty reduces confidence in persistence.
- Long-term structure remains positive and strengthening, which is associated with constructive distant forward conditions, but shorter horizons do not fully confirm that structure.
- Forecast horizons remain mixed and unresolved, which limits confidence in a single directional interpretation without changing the primary volatility-compression state.
- Confirmation across timeframes remains unclear because the medium-term horizon is not expressing a clear directional tendency, which leaves broader structural development incomplete.
Market Insights
- Price movement has become calmer, but incomplete agreement across horizons limits signal reliability and places more emphasis on timing selectivity, as volatility compression is occurring without full confirmation across forecast windows.
- Near-term weakness is recovering, but the remaining defensive central tendency constrains short-horizon persistence and increases holding-period sensitivity, as short-dated expectations remain weaker than the long-dated structure.
- Long-term expectations remain constructive, but intermediate uncertainty limits broad directional confidence, as different maturities reflect different stages of information absorption.
- Variability-driven risk has declined, but directional uncertainty remains present and affects strategy survivability, as lower model-error dispersion coexists with unresolved horizon relationships.
- The options surface remains layered across near-, medium-, and longer-dated expiries, which creates maturity segmentation and limits the usefulness of a single surface-level directional reading.
What Changed This Week
Near-term expectations improved from the prior snapshot, and the uncertainty band narrowed. The horizon remains defensive, but the latest change reflects recovery from weaker short-horizon conditions.
Short-term expectations also improved, and the uncertainty band narrowed. The central structure remains negative, but the week-over-week movement reduced some of the prior deterioration without creating a clear directional shift.
Medium-term expectations improved modestly, and the uncertainty band narrowed. The horizon remains neutral because the central change is not strong enough to establish a directional tendency.
Long-term expectations strengthened, and the uncertainty band narrowed materially. This remains the clearest constructive component of the forward structure.
Across all four horizons, uncertainty bands narrowed relative to the prior snapshot. The main weekly change is a transition toward tighter expectation ranges and lower volatility, with long-term strength still separated from incomplete confirmation in the intermediate horizons.
Volatility Regime
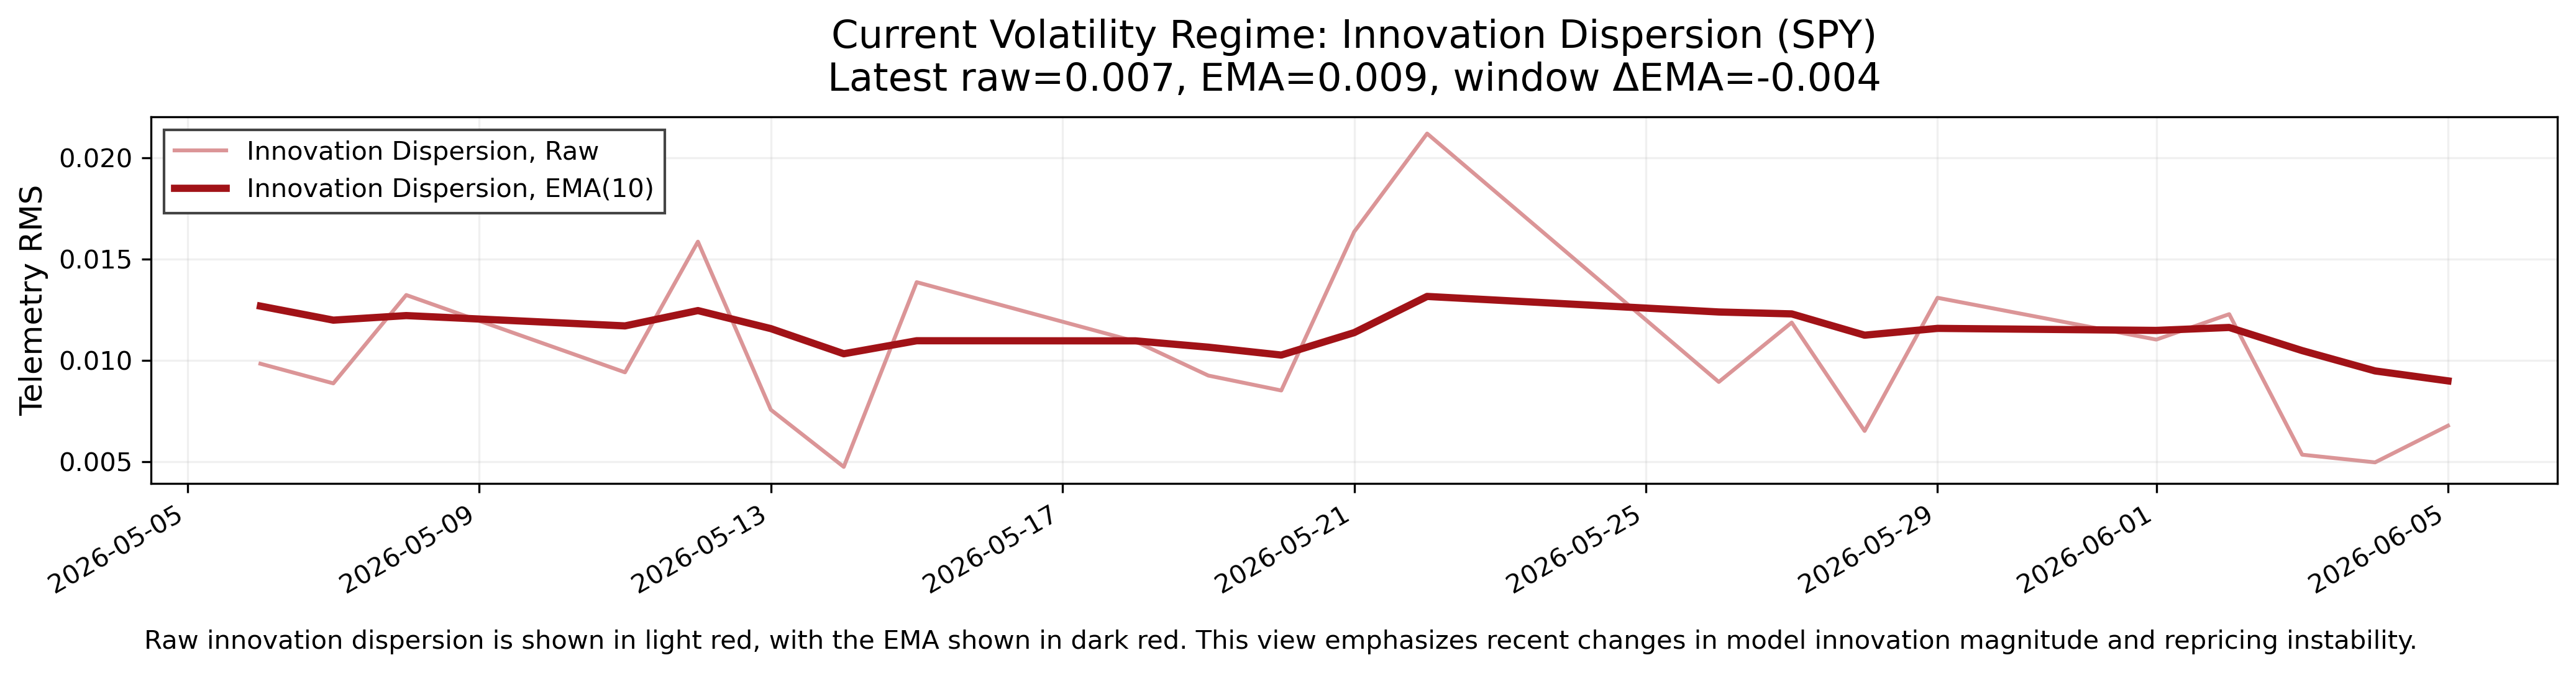
Current volatility conditions are compressing. Raw model error is below the smoothed volatility trend, and the smoothed trend itself is falling. This describes a calmer market environment in which realized movement is tracking closer to prior expectation structure than it was earlier in the observation window.
Volatility in this framework reflects divergence between realized behavior and prior expectation structure. The current compression regime indicates reduced divergence, which is associated with fewer abrupt adjustments and more orderly price behavior. This improves stability, but it does not create broad directional agreement across forecast horizons.
The main constraint is that volatility compression is occurring alongside unresolved intermediate structure. Price movement is calmer, but the short- and medium-term horizons do not provide clear confirmation of the long-term constructive structure. The environment is therefore more stable than unstable, but still incomplete from a directional-confirmation perspective.
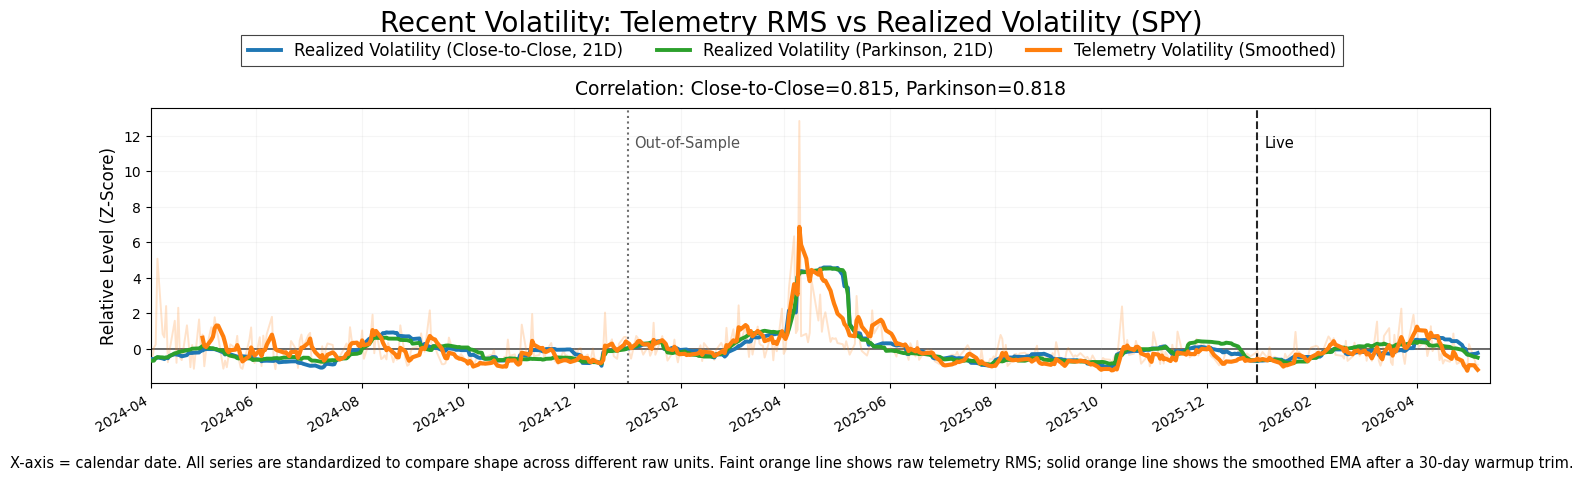
The following chart shows recent market volatility using the RMS of model error. The light line shows raw model error, while the darker line shows the smoothed trend. This view highlights short-term changes in variability and how current movement compares to its underlying trend.
Horizon-Averaged Forward Expectations
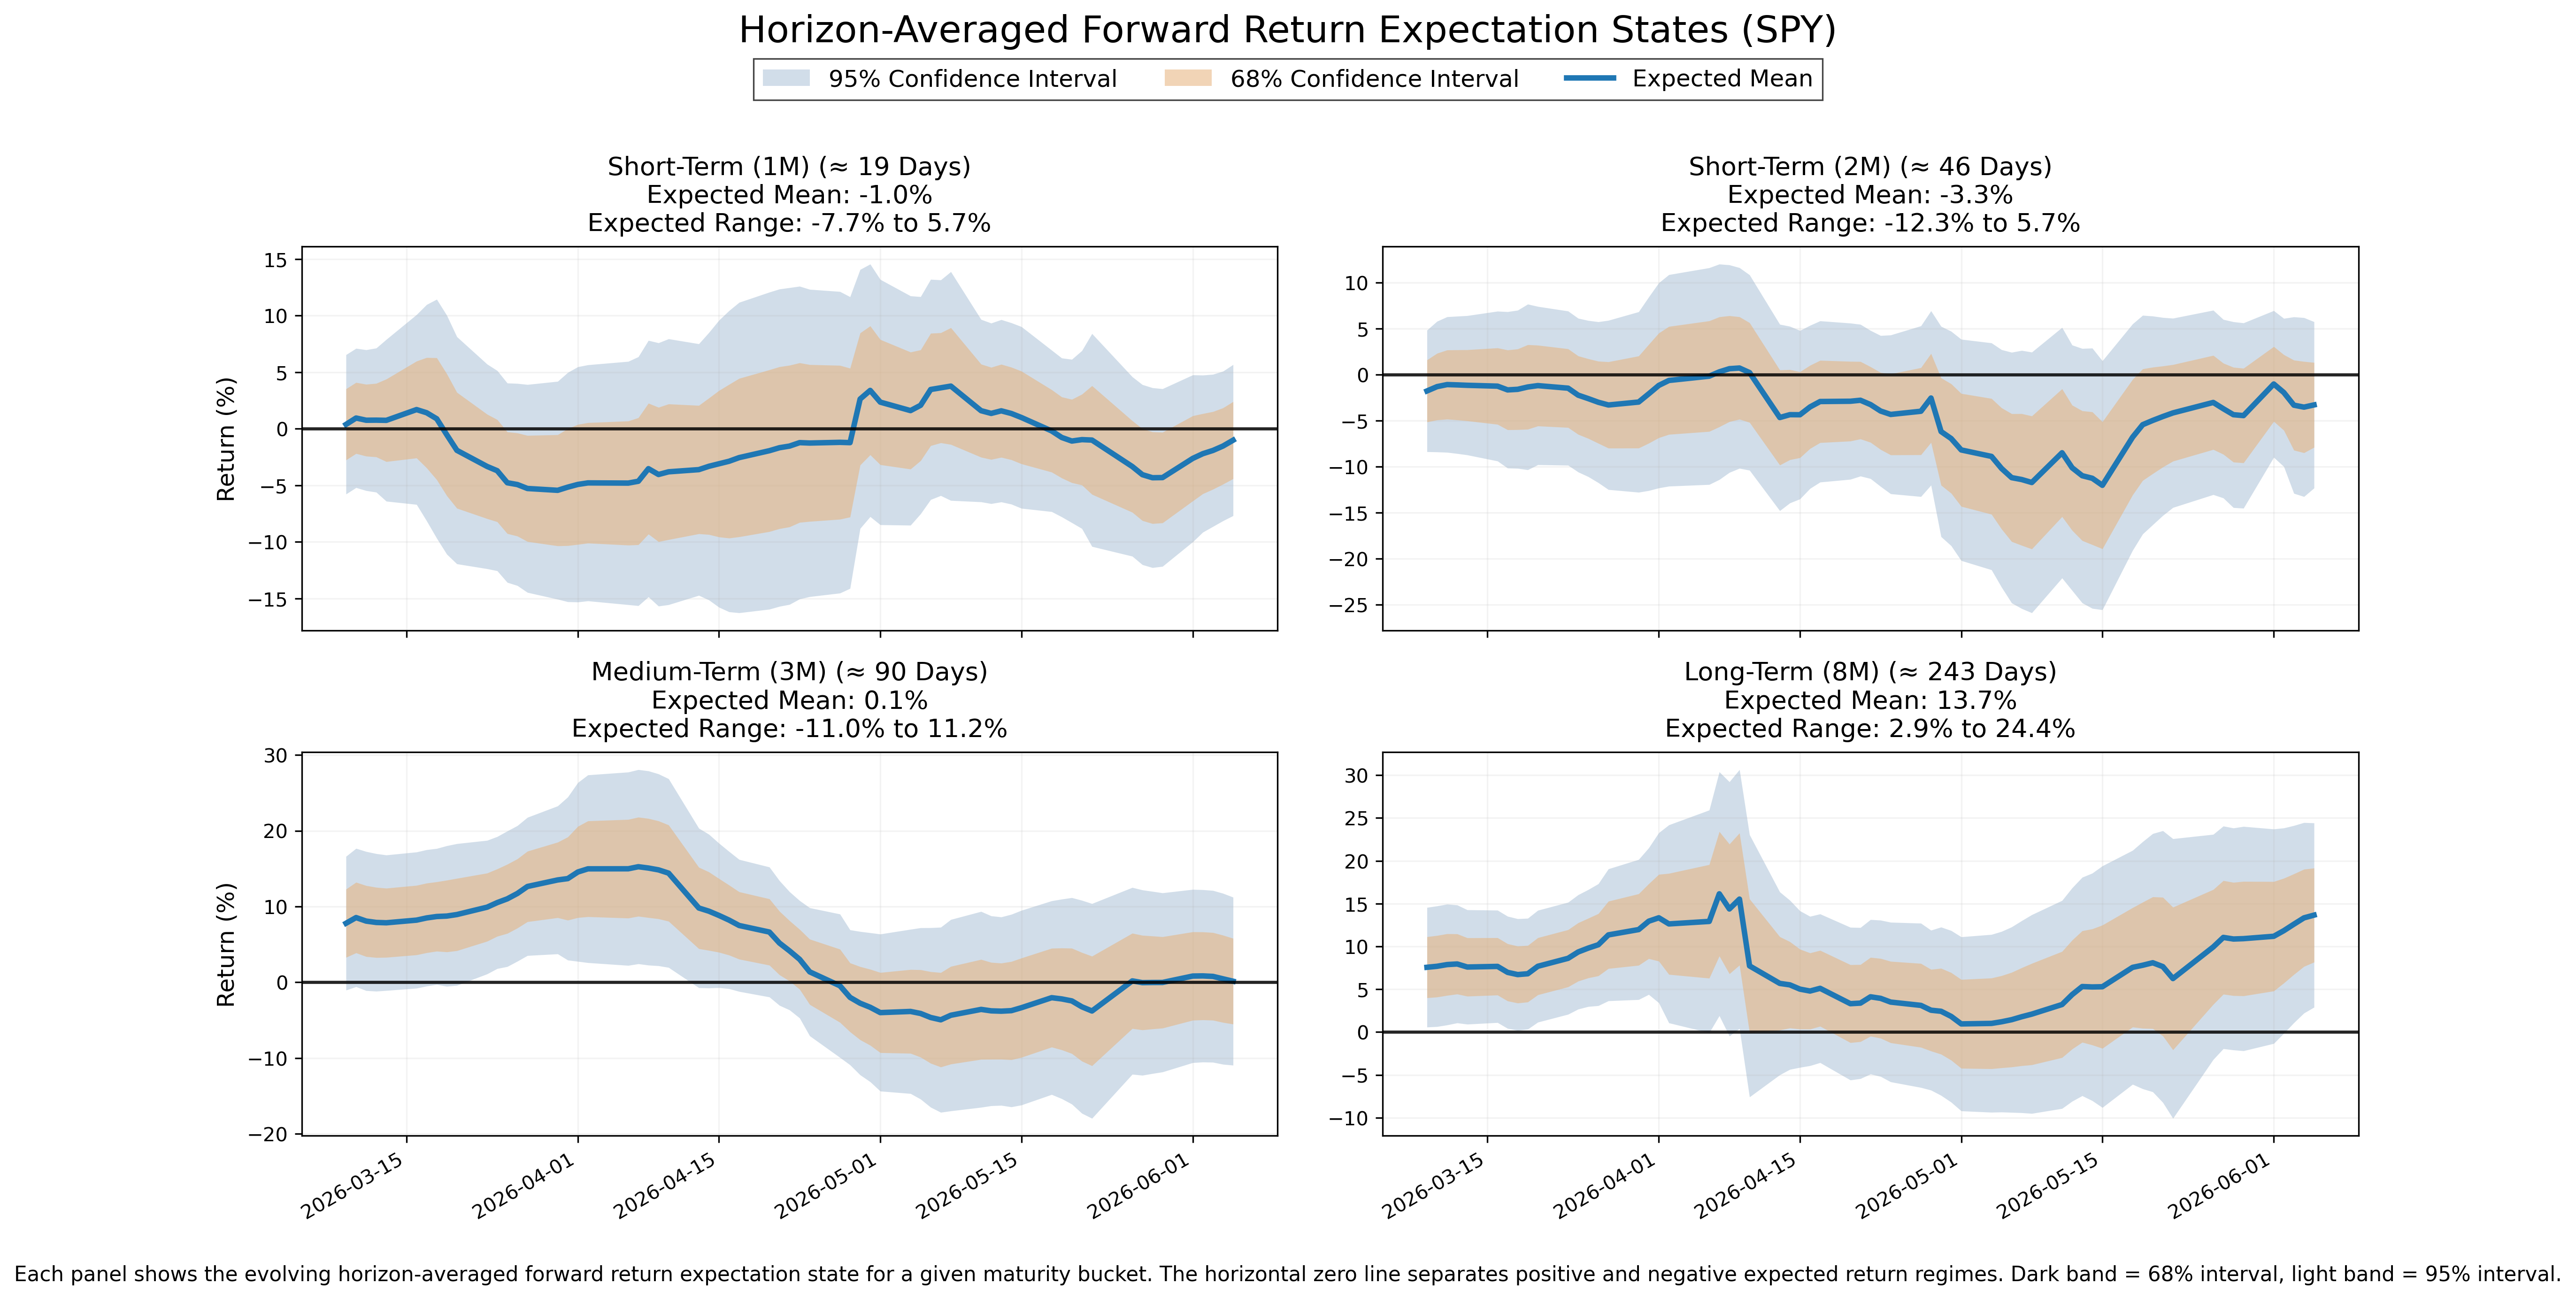
Near-Term (~2–4 weeks)
• State: Mixed
• Uncertainty: Tight
• Interpretation: Near-term structure remains defensive but is recovering. Volatility compression is associated with calmer movement, and tight uncertainty improves reliability, but the central tendency remains negative.
Short-Term (~1–2 months)
• State: Mixed
• Uncertainty: Moderate
• Interpretation: Short-term structure remains negative and stable or unclear. Price behavior is associated with limited continuation quality, and moderate uncertainty constrains confidence in short-horizon persistence.
Medium-Term (~2–4 months)
• State: Mixed
• Uncertainty: Wide
• Interpretation: Medium-term structure remains unresolved and does not currently express a directional tendency. Wide uncertainty is associated with less reliable movement and keeps intermediate confirmation incomplete.
Long-Term (~6–12 months)
• State: Positive
• Uncertainty: Moderate
• Interpretation: Long-term structure remains constructive and continues to strengthen. Volatility compression supports a more stable environment, but unresolved shorter horizons limit broader confirmation of the long-dated signal.
The following chart shows the evolution of horizon-averaged forward expectation states. Each panel represents a maturity window, with the central line showing the average expected return structure across that horizon bucket and shaded regions showing uncertainty.
Options Market Structure
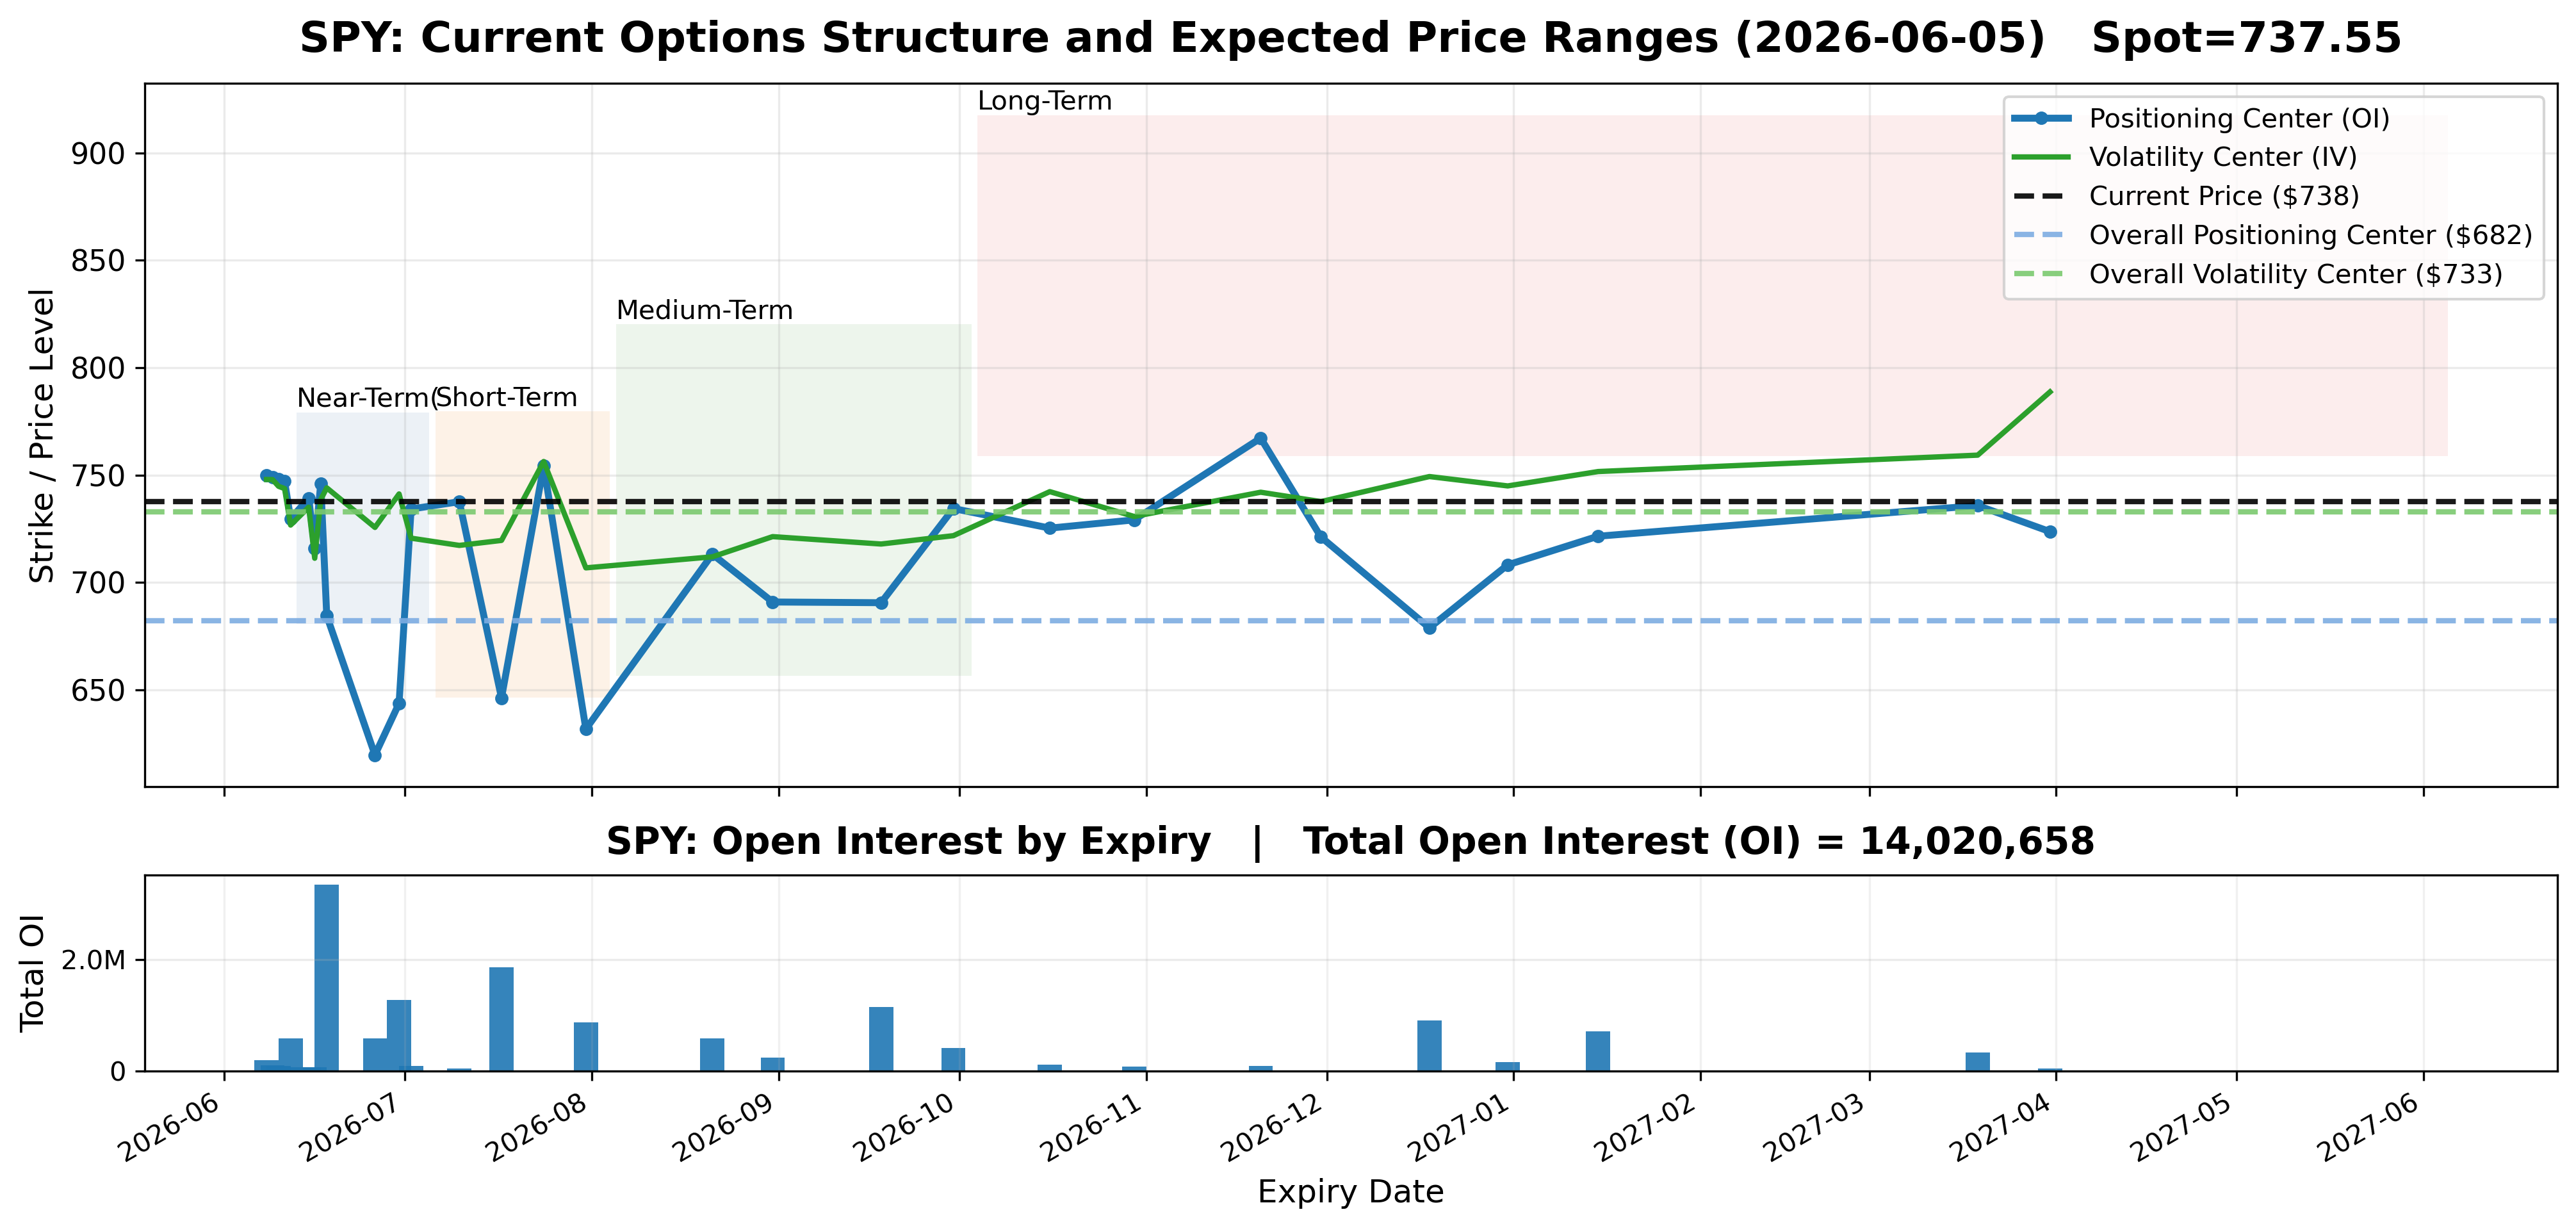
Current options structure is concentrated in the June 18 expiration, which holds the largest listed share of open interest. Additional large open-interest layers appear in July, late June, September, December, and January expiries, creating a surface with several distinct maturity layers rather than one evenly distributed profile.
The near-dated structure includes June 12, June 18, June 26, and June 30 expiries. The intermediate layer includes July 17, July 31, August 21, and September 18. Longer-dated participation appears in December 2026 and January 2027. This organization describes current positioning distribution across expiration dates.
The overall volatility center is close to spot, while the overall positioning center is lower than both spot and the volatility center. This separation indicates that open-interest concentration and implied-volatility concentration are organized around different levels. The separation is descriptive of the options surface and does not imply directional movement.
The following chart shows today’s options market structure across expiration dates. Each point represents a future expiry, with positioning (open interest) and volatility (implied volatility) centers derived from current options data. Shaded regions show the expected price ranges for each horizon based on current market conditions. This is a cross-sectional view at a single point in time, not a time-series.
Bottom Line
The current market condition is defined by volatility compression, recovering near-term weakness, unresolved medium-term structure, and strengthening long-term expectations. Realized behavior is diverging less from prior expectation structure, so the market is calmer than it was during the prior instability phase. Cross-horizon consistency remains fragmented, but it acts as a qualifier rather than the dominant market condition.
The near-term horizon remains negative but is improving, the short-term horizon remains negative without meaningful directional evolution, and the medium-term horizon remains neutral and unresolved. The long-term horizon remains positive and strengthening. This creates uneven horizon evolution rather than a completed directional regime.
Behaviorally, lower volatility reduces the dominance of abrupt repricing and supports more orderly movement. Persistence remains constrained because intermediate structure has not developed a clear directional tendency. Reversal risk and failed continuation remain relevant where movement depends on short- or medium-term confirmation.
From a decision-context perspective, volatility risk is less dominant than timing and signal-reliability risk. Short-horizon signals remain sensitive because near-term recovery is still defensive. Long-horizon signals remain stronger, but intermediate uncertainty affects how much persistence can be assigned to them.
In plain English, the market has calmed down, but it has not become fully coordinated. Near-term conditions are improving from weakness, long-term conditions remain constructive, and the middle of the structure is still unresolved. The current state is a volatility compression regime with incomplete directional agreement.
Model Calibration Assessment
This report is generated from the output of a proprietary quantitative system that measures current options market structure, conditions, and forward expectations. This section evaluates the correctness and calibration of the underlying model.
Calibration Status: Calibrated.
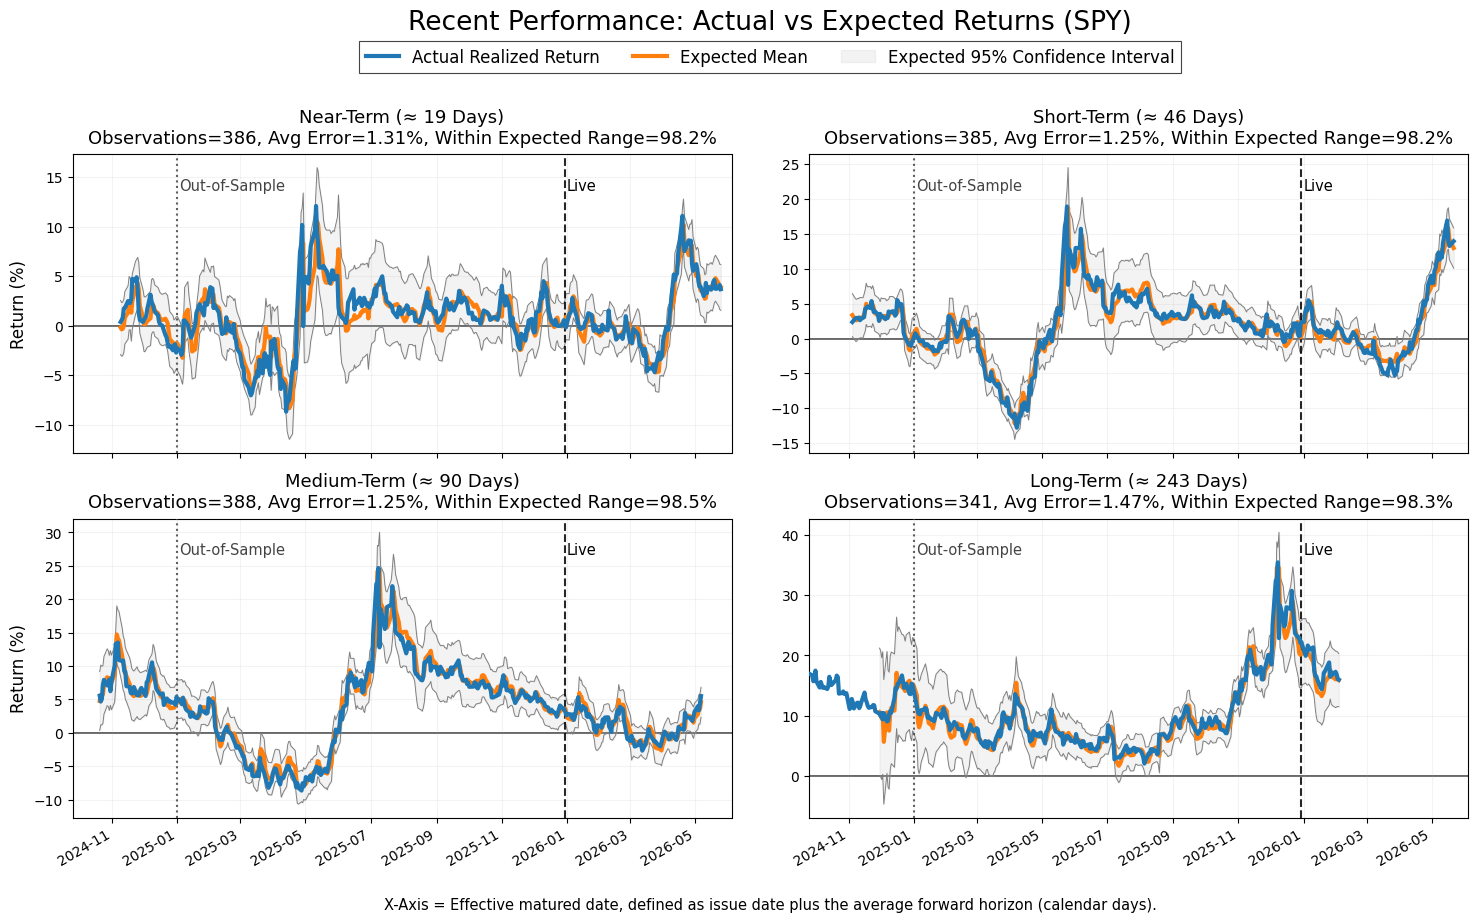
Realized returns remain within the expected confidence intervals across all forecast horizons. Coverage remains high across near-term, short-term, medium-term, and long-term windows, with realized outcomes staying inside the expected range at roughly 98% across the displayed validation set.
The error distribution appears stable. Average forecast error remains contained across horizons, and there is no visible breakdown in the relationship between expected and realized returns. The model tracks major changes in realized return structure without persistent overshooting or undershooting.
There is no clear directional bias or sustained drift visible in the validation chart. Expected returns continue to follow realized returns across the live period, with deviations remaining inside the modeled uncertainty bands.
The volatility signal remains aligned with realized volatility. The innovation measure rises during periods when realized market behavior diverges from prior expectations and falls when realized behavior becomes more consistent with the model. Current conditions show reduced innovation magnitude, supporting the conclusion that the model remains calibrated.
If you find this useful, you can support the work here. I’d also really appreciate hearing how you’re using this market data: any feedback helps me make this more useful in real workflows.
Trial API access to daily telemetry data is available upon request.