SPY Financial Telemetry - May 1, 2026
Market-implied expectations derived from options market structure.
VYREON LABS
May 03, 2026
This report is generated from the output of a proprietary quantitative system that measures market structure, conditions, and forward expectations, translating system measurements into descriptive statements about the market environment.
Executive Summary
Expanding volatility continues to produce faster repricing and larger movement variability, reducing the reliability of clean directional continuation. Shorter horizons remain reactive and reversal-sensitive, while longer-duration structure appears comparatively more orderly but still non-directional. Market behavior remains fragmented across maturities rather than aligned into a unified directional regime.
Market Snapshot
Regime: Expanding volatility
Near-Term (~2 to 4 weeks): Transitional, partially persistent
Short-Term (~1 to 2 months): Fragmented, reversal sensitive
Medium-Term (~2 to 4 months): Transitional, moderately dispersed
Long-Term (~6 to 12 months): Orderly, non-directional structure
Structure: Concentrated, maturity layered
Market State
- Expanding volatility reflects rising variability and faster repricing, where larger intraperiod swings reduce the reliability of clean directional continuation.
- Near-term mixed structure with moderate uncertainty shows partial follow-through after moves, but frequent resets constrain short-horizon persistence.
- Short-term mixed structure with wide uncertainty is associated with non-directional movement and frequent reversals, limiting timing stability across the one-to-two-month window.
- Medium-term mixed structure with moderate uncertainty reflects transitional behavior across consolidated maturities, where movement lacks durable structural alignment.
- Long-term mixed structure with tight uncertainty shows a more orderly but non-directional backdrop, limiting broader conviction despite narrower dispersion.
- Cross-horizon alignment remains uneven, with near-term improvement offset by weaker short- and medium-term structure, making interpretation dependent on horizon rather than unified conditions.
Market Insights
- Short extensions that fail to sustain continuation reduce trend persistence reliability, which makes continuation-style approaches more vulnerable to false follow-through and reduces confidence in holding through initial moves.
- Wide short-term dispersion increases reversal frequency, which destabilizes entry timing and lowers the reliability of signals that depend on sustained directional movement.
- Expanding volatility amplifies movement magnitude around reference levels, which increases variability in outcomes and reduces the effectiveness of tightly defined thresholds.
- Mixed conditions across horizons reduce multi-timeframe alignment, which weakens signal consistency and makes cross-horizon confirmation less reliable.
- The contrast between tighter long-term dispersion and unstable short-term behavior separates structural context from execution noise, which makes short-horizon strategies more exposed to disruption despite a more orderly backdrop.
What Changed This Week
Near-term expectation improved while its uncertainty band tightened, shifting the shortest horizon toward a more constructive but still mixed condition.
Short-term expectation weakened while its uncertainty band expanded, adding fragmentation across the one-to-two-month window.
Medium-term expectation weakened most sharply while its uncertainty band widened, reducing alignment across the central structural horizon.
Long-term expectation softened while its uncertainty band expanded, though the current longer maturity view remains comparatively orderly and non-directional.
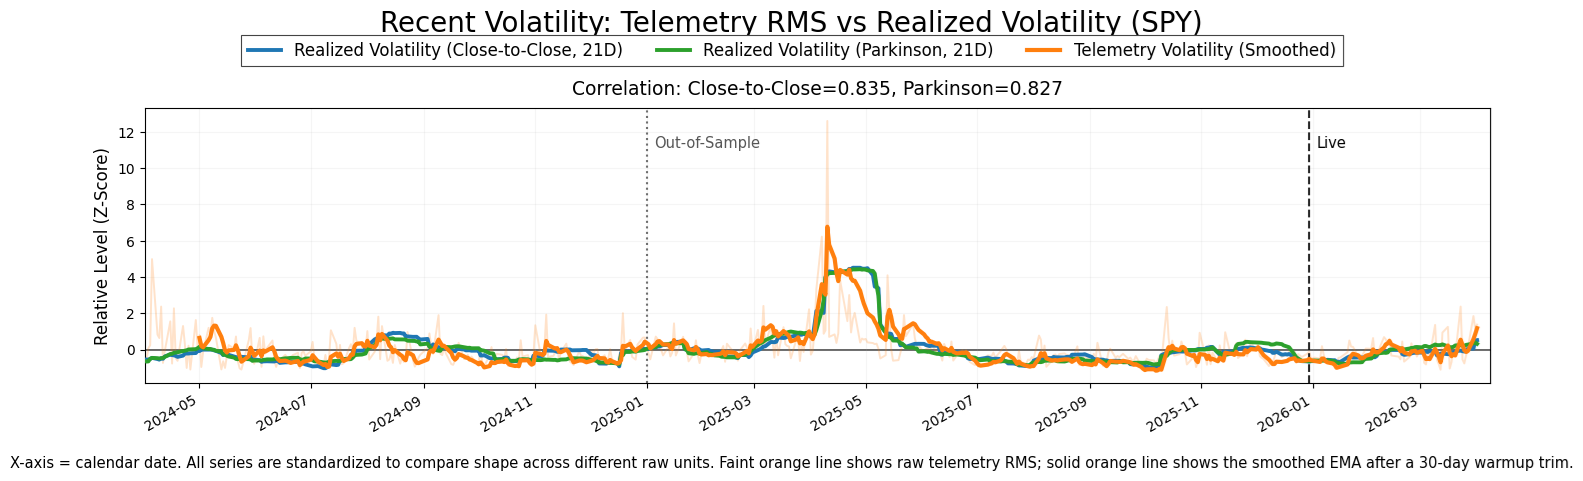
Volatility expanded further, with variability remaining above its smoothed trend and the trend rising across the window.
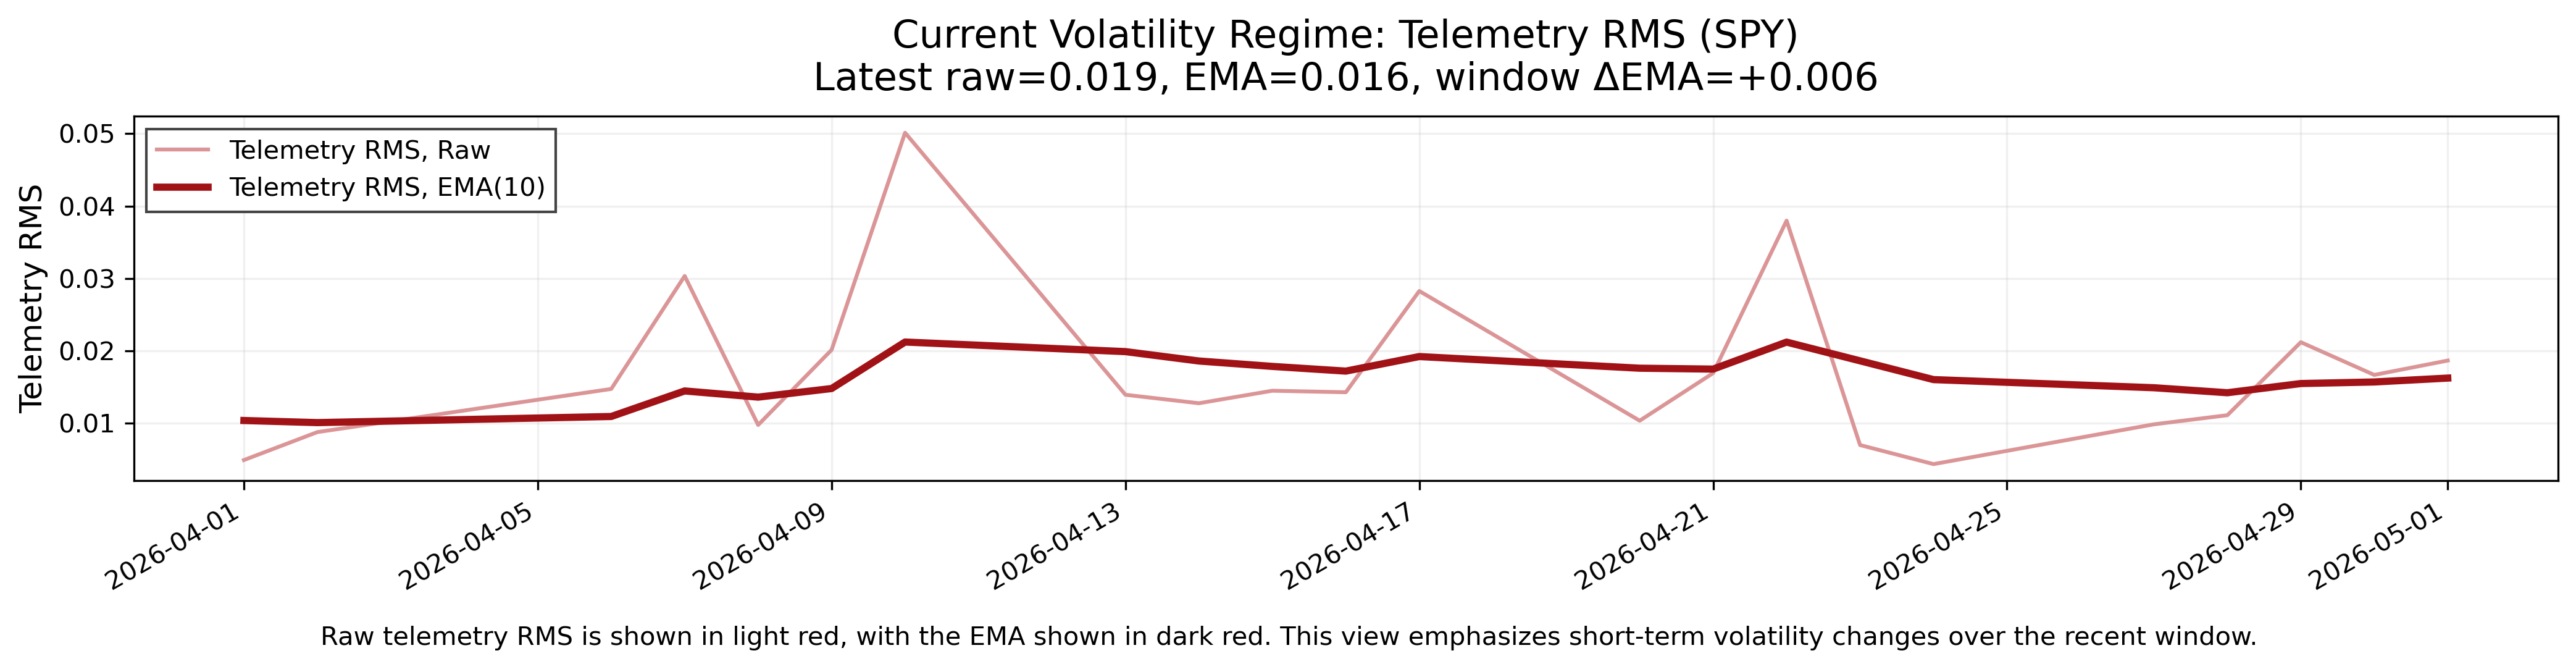
Volatility Regime
The volatility regime is expanding, with current variability above its smoothed trend and the trend rising across the lookback window. This reflects faster repricing, larger swing amplitude, and less orderly absorption of new information. Movement becomes more reactive and less stable as variability exceeds its baseline, reducing the reliability of clean directional continuation. The constraint is that short-horizon signals carry more noise relative to underlying structure, lowering confidence in persistence when movement accelerates ahead of broader alignment.
This chart shows recent market volatility using the RMS of model error. The light line shows raw model error, while the darker line shows the smoothed trend. This view highlights short-term changes in variability and how current movement compares to its underlying trend.
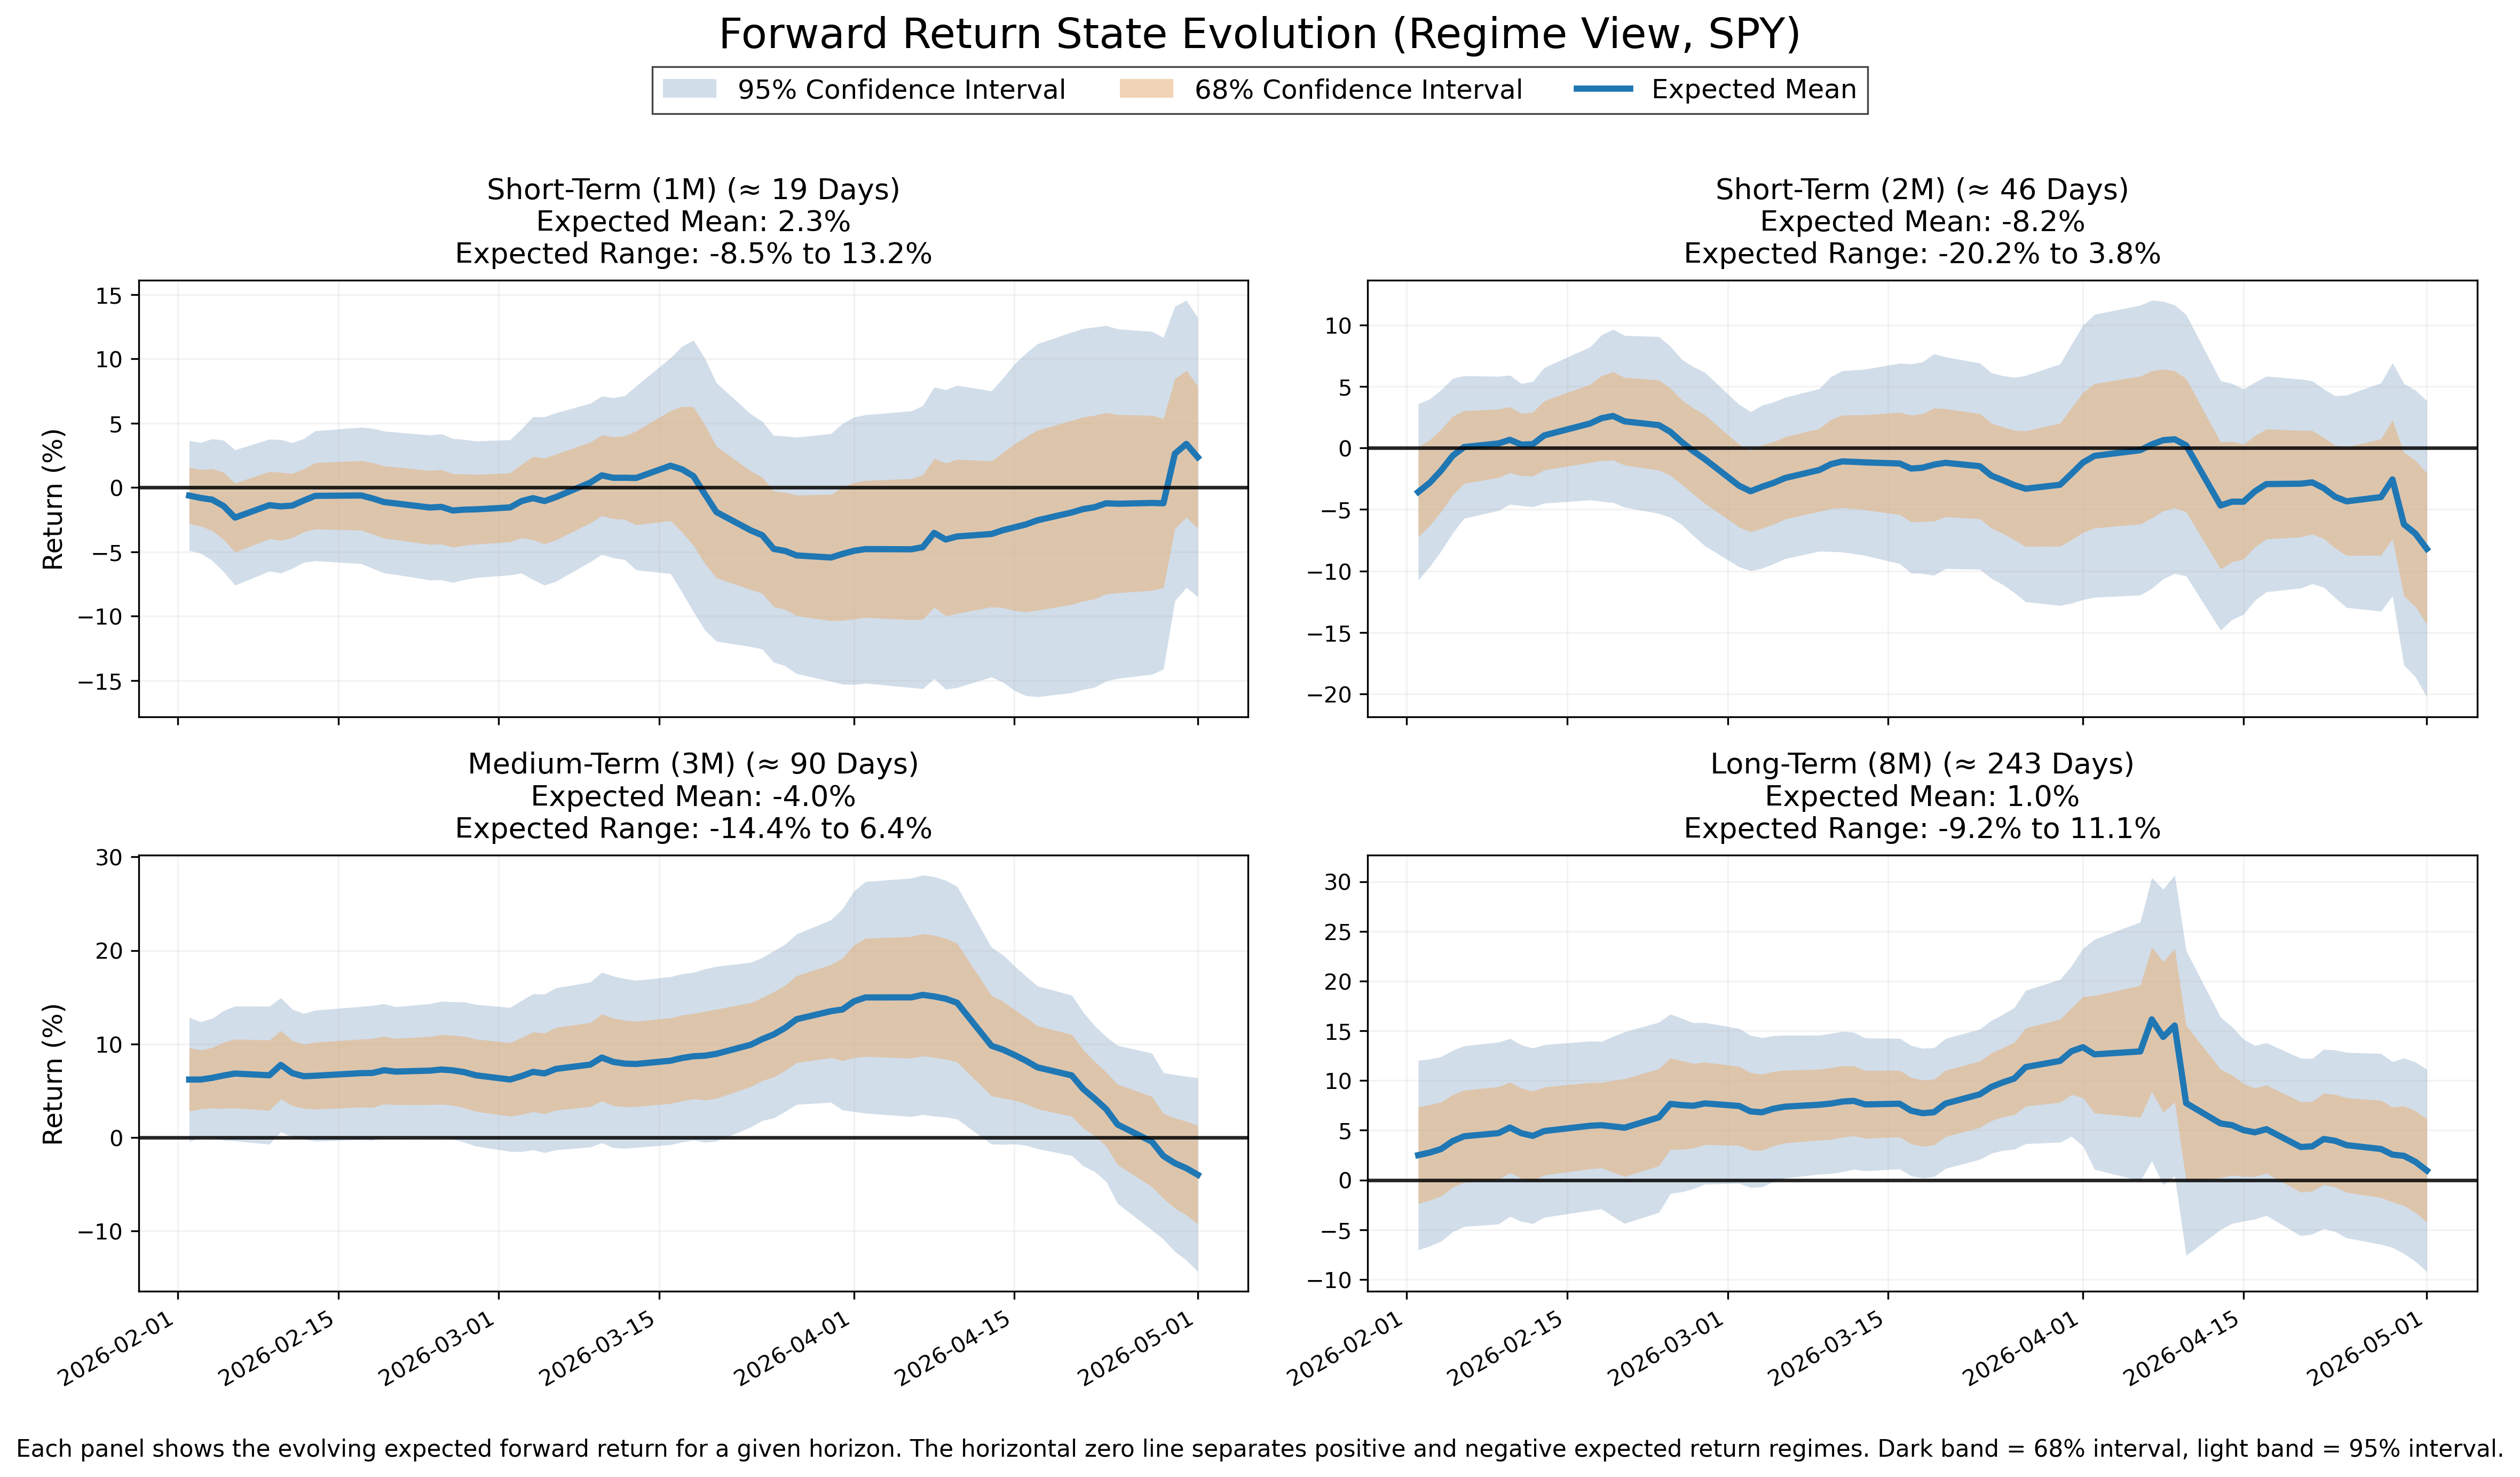
Forward Expectations
Near-Term (~2–4 weeks)
- State: Mixed
- Uncertainty: Moderate
- Interpretation: Transitional short-horizon structure is associated with partial continuation, frequent resets, and amplified reaction speed.
Short-Term (~1–2 months)
- State: Mixed
- Uncertainty: Wide
- Interpretation: Broad dispersion is associated with non-directional movement, sharp reversals, and unstable timing.
Medium-Term (~2–4 months)
- State: Mixed
- Uncertainty: Moderate
- Interpretation: The central horizon reflects transitional behavior where movement has room to extend but lacks durable alignment.
Long-Term (~6–12 months)
- State: Mixed
- Uncertainty: Tight
- Interpretation: Longer maturity structure appears more orderly, though price behavior remains non-directional rather than strongly persistent.
This chart shows the evolution of expected forward return across time horizons. Each panel represents a different horizon, with the central line showing the expected mean and shaded regions showing uncertainty. This view reflects how market-implied expectations and dispersion have evolved over time.
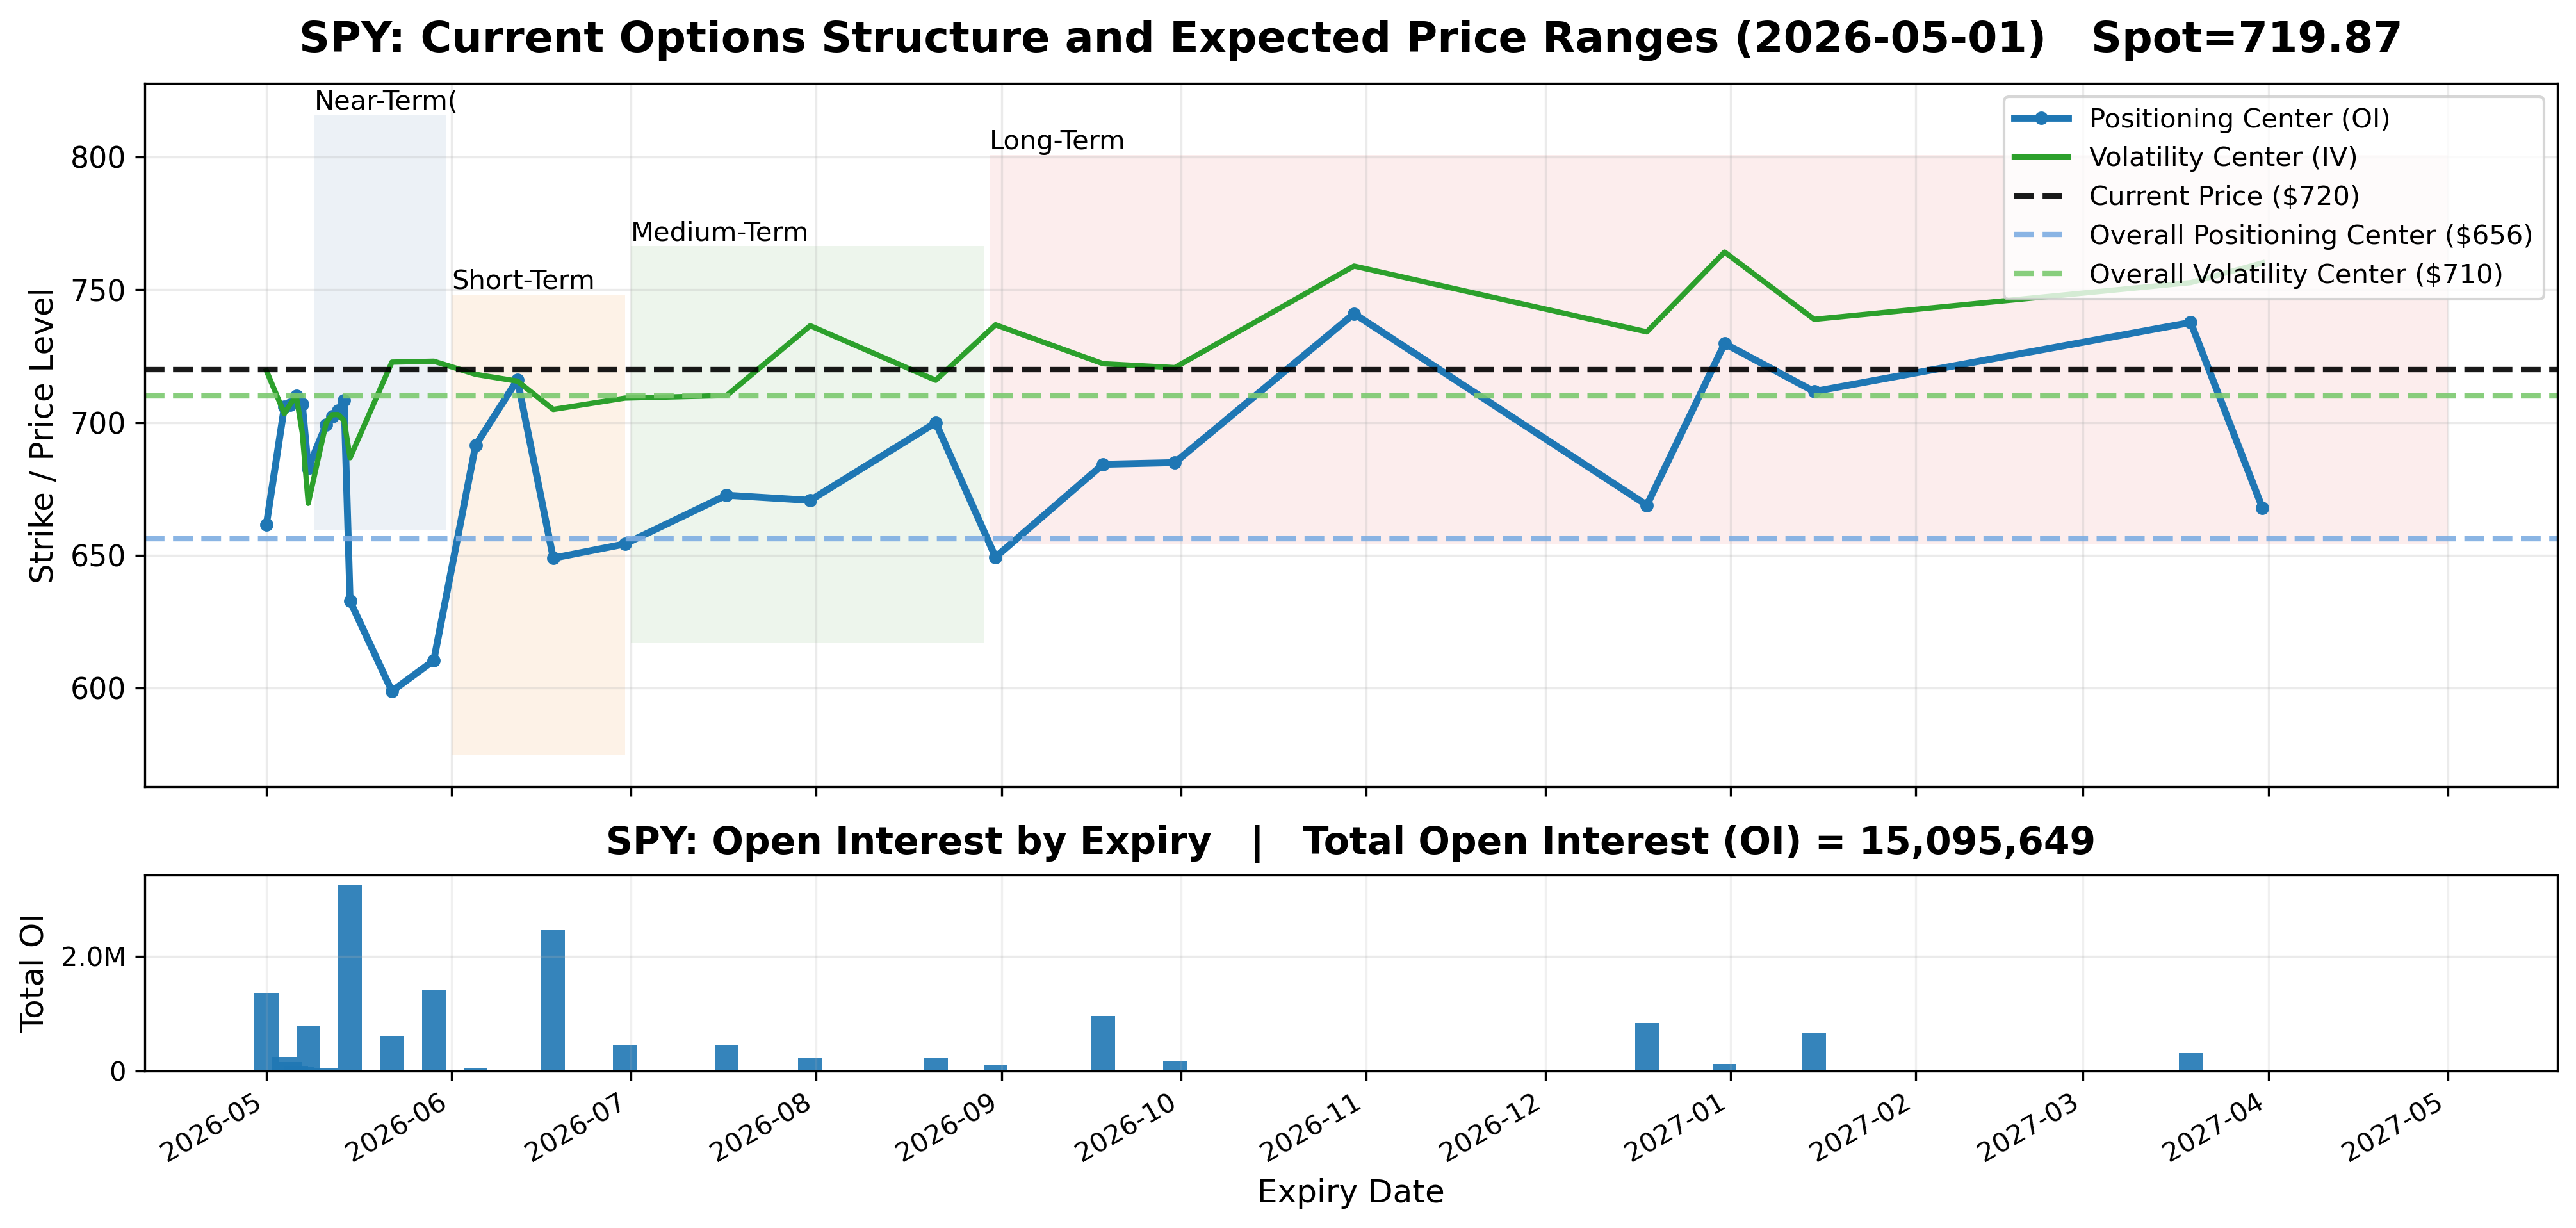
Options Market Structure
Current options positioning is concentrated across several near and medium expiries, with large open-interest clusters in mid-May, mid-June, late May, current-expiry contracts, and later-dated maturities. The positioning and volatility centers remain separated, reflecting a layered surface with multiple reference points rather than a single unified anchor.
This chart shows today’s options market structure across expiration dates. Each point represents a future expiry, with positioning (open interest) and volatility (implied volatility) centers derived from current options data. Shaded regions show the expected price ranges for each horizon based on current market conditions. This is a cross-sectional view at a single point in time, not a time-series.
Bottom Line
SPY’s environment is defined by expanding volatility, mixed short-term behavior, and uneven cross-horizon alignment. Short horizons show reversals and timing sensitivity, while the longer horizon remains more orderly but non-directional. The regime supports active movement but constrains confidence in clean persistence.
This environment reduces confidence in sustained directional positioning and increases sensitivity to timing and variability, particularly for short-horizon execution.
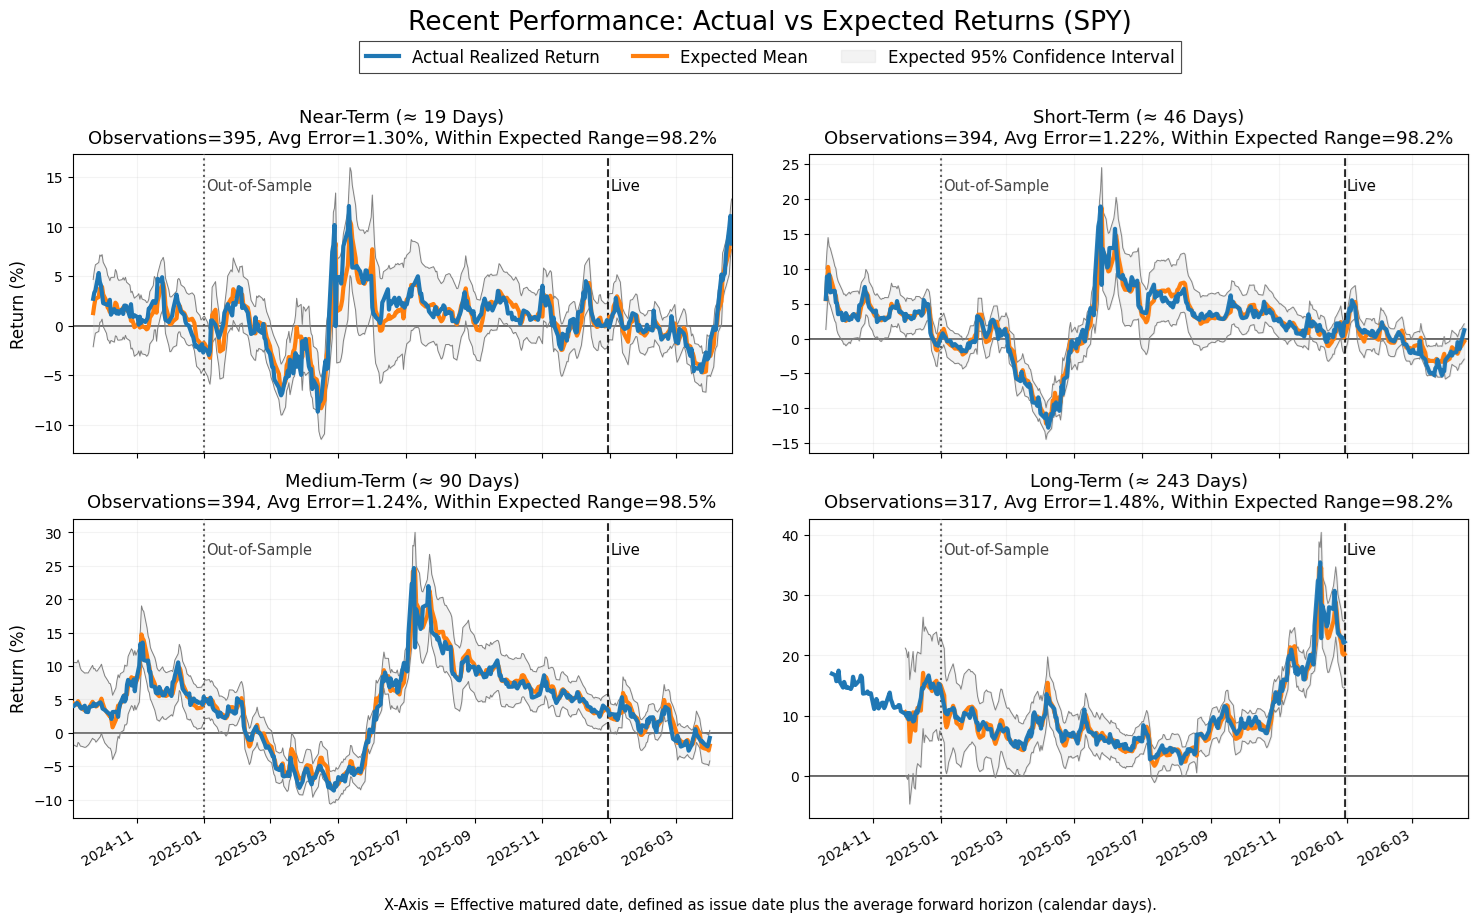
Model Calibration Assessment
The model remains calibrated.
Realized returns remain inside the expected 95% confidence intervals across all four horizons at roughly 98% coverage. That is slightly conservative rather than under-calibrated, meaning the confidence bands appear wide enough to contain realized outcomes without showing obvious failure at the tails.
The error distribution appears stable. Average error is clustered tightly across horizons, ranging from about 1.2% to 1.5%, and there is no visible breakdown between the out-of-sample period and the live period. Actual realized returns continue to track the expected mean closely enough for the model to remain behaviorally consistent.
There is no visible persistent bias or drift. The actual return line moves both above and below the expected mean over time, rather than staying systematically above it or below it. The live-period behavior also does not show a clear directional calibration failure.
Volatility calibration remains intact. Telemetry volatility continues to track realized volatility with strong visual agreement and high reported correlations, while the major volatility spike is captured by the telemetry series rather than missed.
Bottom line: calibrated, stable, and slightly conservative. No visible evidence of systematic bias, live-period drift, or confidence-band failure.
If you find this useful, you can support the work here. I’d also really appreciate hearing how you’re using this market data: any feedback helps me make this more useful in real workflows.
Weekly financial telemetry reports. Delivered Sundays.